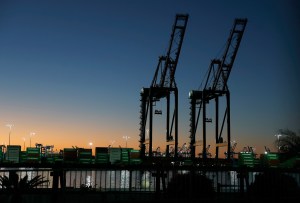
Though growth came slower than it has in previous months, year-over-year container import and export volume increased last month for the 10 largest ports in the U.S., keeping up a trend.
That’s according to new data from shipping expert John McCown, who noted inbound containers at those ports saw a year-over-year increase of 5.8 percent in May.
While that may seem like an impressive metric—and marks the eighth consecutive month of increases of year-over-year import volume—it pales in comparison to the double-digit increases February, March and April brought. Respectively, those figures came in at 26.5 percent, 19.9 percent and 13.4 percent.
Related Stories
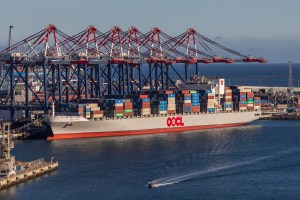
Though its growth didn’t come in as high as previous months, May did bring the highest inbound volume the ports had seen in 21 months. Over 1.9 billion 20-foot equivalent units (TEUs) came through the ports, which was 1 percent higher as compared with April of this year.
Nonetheless, May 2022 still holds the all-time high for the month with the most inbound volume on record. For reference, May 2024 still lagged May 2022 by 15.5 percent. McCown suggested the reason May typically sees such high volumes has to do with the outset of holiday preparations.
“May is traditionally the busiest month of the year for inbound volume to the U.S. as well as overall container volume worldwide. The reason for both relates to the importance of the holiday season for retailers and the beginning of the build up in inventories for that season,” he wrote.
Even in the longer-term, imports are up for May. As compared with May 2019, this year’s imports came in 10.1 percent higher, which means the CAGR would be 1.9 percent; while still lower than April’s 3 percent five-year CAGR, that growth is still positive. The five-year comparisons, McCown said, are used to offset pandemic effects, though those days may be in the recent past.
“We are now beyond year-over-year gains having anything to do with the pandemic. These recent gains are saying something about the underlying related to the goods economy,” he wrote.
Though imports overall improved, some ports saw stronger gains than others for May imports. The Port of Seattle saw a 32.5 percent year-over-year increase as the Port of Savannah, Georgia, saw a 23.8 hike and the Port of Norfolk, Virginia, netted 19 percent gains.
Meanwhile, The Port of Charleston, South Carolina, saw an 8 percent decline since last year. The Port of Los Angeles saw a 4.5 percent decrease, as did the Port of Long Beach, California.
Exports, too, saw a boost.
In May, overall outbound volume came up by 4.9 percent among the 10 largest ports in the U.S., as compared with May 2023. Like imports, that lags behind February, March and April’s growth rates of 11.6 percent, 7.6 percent and 8.2 percent, respectively.
However, exports didn’t see the same five-year growth stability imports saw. McCown’s data shows a negative CAGR of 2.5 percent for exports since May 2019.
The ports of Los Angeles, Seattle and Houston saw the top growth year-on-year growth rates for exports, with Los Angeles up 23.7 percent, Seattle up 20.8 percent and Houston up 20.6 percent. But the rates of change for the two worst ports proved considerably worse for exports than imports, with Long Beach’s exports tanking by 21.1 percent and Charleston diving by 11.3 percent.
The continued increases in volume, both for imports and exports, may be causing an increase in spot rates, which are short-term freight prices for one-off details that lack a long-term contract.
“Spot rates have spiked to levels not seen since mid-2021 during the pandemic,” McCown wrote, noting that the Shanghai Containerized Freight Index (SCFI) measure came in at over twice what it was at the end of the first fiscal quarter.
“The Red Sea situation requiring container ships to go the long way on a key lane had the effect of cutting worldwide capacity by 8 percent. With that and the recent uptick in volume, pricing ratcheted up,” McCown wrote in his report.